Step 1 - Sample upload
LandScape+ requires soil survey results to outline a model area. It has in-built prompts and validation steps to help the user upload their data in the required format.
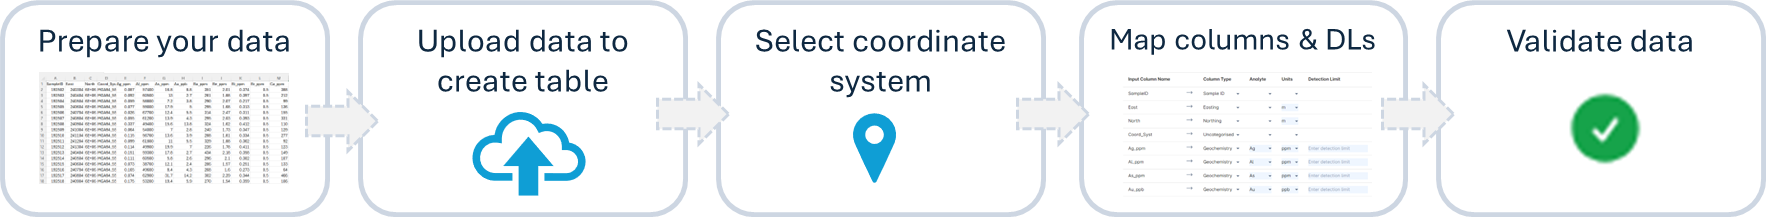
There are five main steps:
- Prepare your data
- Upload your data and define table setting
- Select the appropriate coordinate system
- Assign columns and fill in details
- Run a data validation in the software
The software saves you progress when you click on Action buttons (e.g., the Continue button). – If you (or your internet connection) get interrupted it will pick up near where you left next time you log in.
1.1 Prepare your data
Quality inputs = quality outputs
Good models can only be produced from good data. To make the sample upload process as smooth as possible, prepare your data prior to upload.
✔️ Data format
The sample upload interface can input CSV and Excel files. All data must be contained in one CSV file or one Excel workbook sheet
Compulsory columns
As a minimum your data must contain the following 3 columns:
-
Sample ID with unique values
-
Sample location with Latitude and Longitude in decimal degrees (for WGS84, GDA94 and GDA2020) OR Easting and Northing in meters (for MGA Zones)
-
At least one geochemical analyte (Au, Ag, As, Ge, etc.)
There is no upper limit on the amount of columns you can upload.
Additional file requirements
- All values below the detection limit must be replaced by ½ the detection limit
- Sample ID and coordinate columns must not contain empty rows
- Your file must contain a header row to label/describe the columns, e.g., Sample ID, Cu ppm
- All analytical results must be positive numerical values and cannot be zeros (0)
- Know your units and have a list of the detection limits for each analyte (they can be in the file you upload, but do not have to be)
✔️ Values below the detection limit
Any values below the detection limit in your geochemical data must be replaced by ½ the detection limit for outlier definition.
Not replacing values below the detection limit with ½ the detection limit will affect outlier definition. The user can choose to ignore these warnings at their own risk.
BACKGROUND
The statistical definition of outliers by landscape type requires the imputation (replacement) of values below the detection limit as their exclusion can result in strong bias on statistical evaluation. Many imputation methods have been proposed; some of the most common introduce a positive bias (e.g., use of detection limit) or a negative bias (e.g. using 0).
This is why we recommend the replacement of all values below the detection limit with half the detection limit value. This is commonly used in the statistical evaluation of soil geochemical data and close to the simple substitution replacement factor suggested by Sandford et al. (1993) for low degrees of missing data. Where large amounts of analytical results are below the detection limit, this should always be considered when interpreting statistical calculations.
✔️ Datasets with multiple detection limits
It is common for exploration surveys to be a combination of multiple laboratory analyses from different points in time. Detection limits for the same analyte may have changed since the first samples were analysed despite using the same analytical technique. This is especially pertinent when datasets contain historic data from previous exploration activities. The recommended action is to replace all values below the detection limit by ½ the lowest detection limit for each analyte. Extra care should be taken to replace the correct values as in this case the built-in validation of detection limit values (see last step) may not be effective. The validation process might flag values as erroneous.
1.2 Create table
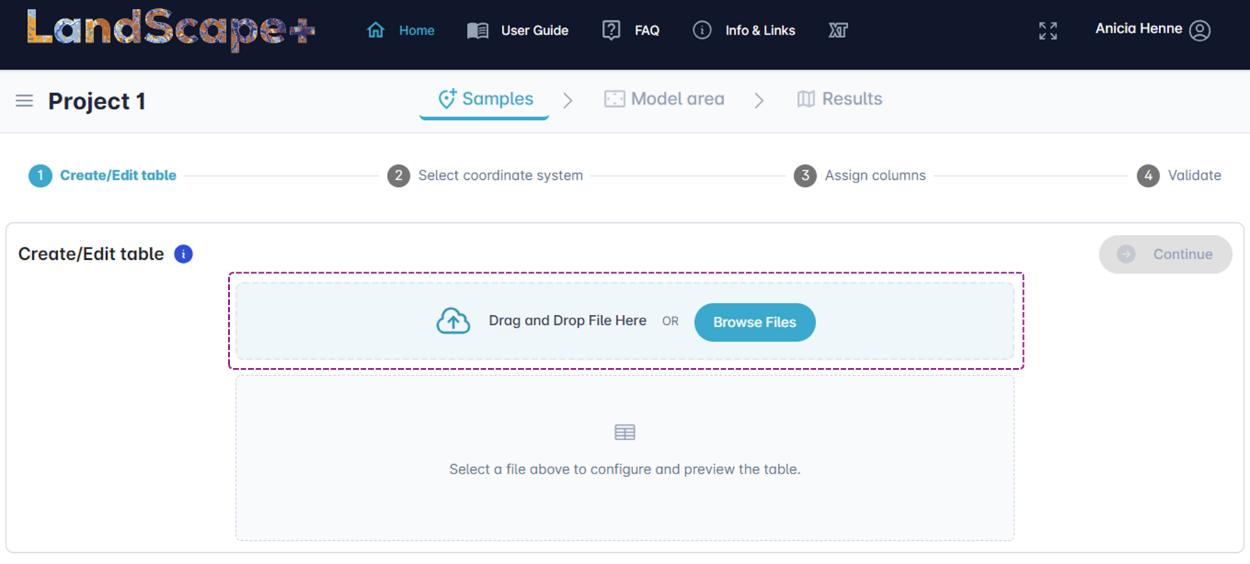
✔️ Upload samples
Upload your sample data by either drag-dropping the prepared file or using the Browse Files button. The app will create a copy of your data on the server. This copy will be used to run the model. Your original data file (local copy) will not be changed.
✔️ Adjust table settings
The User interface allows you to adjust table settings to fit your data (left hand panel). A preview of your data is visible on the right-hand side (if your computer screen’s scale and layout is very high (>125 %), you may need to scroll down as the Table preview might be below the Table settings pane).
The default settings accommodate most data files. Check if they apply to your data and see below for detailed explanations.
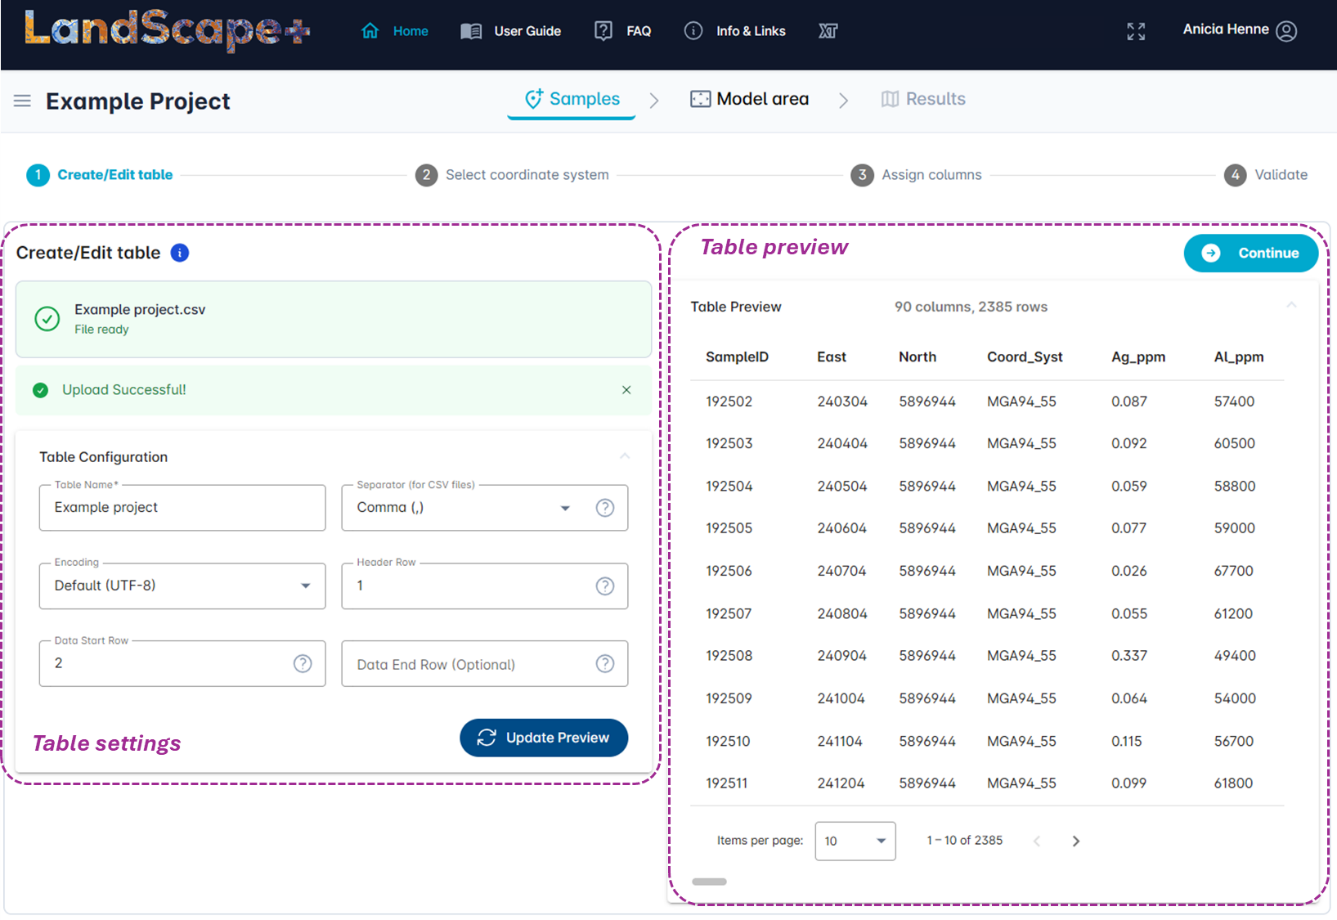
Table settings for CSV files
The Table settings are set to default formats that are most common. The upload also automatically recognises whether your file is a CSV or an Excel file. You can hit the Update Preview button at any point to view how the table settings affect your data read-in.
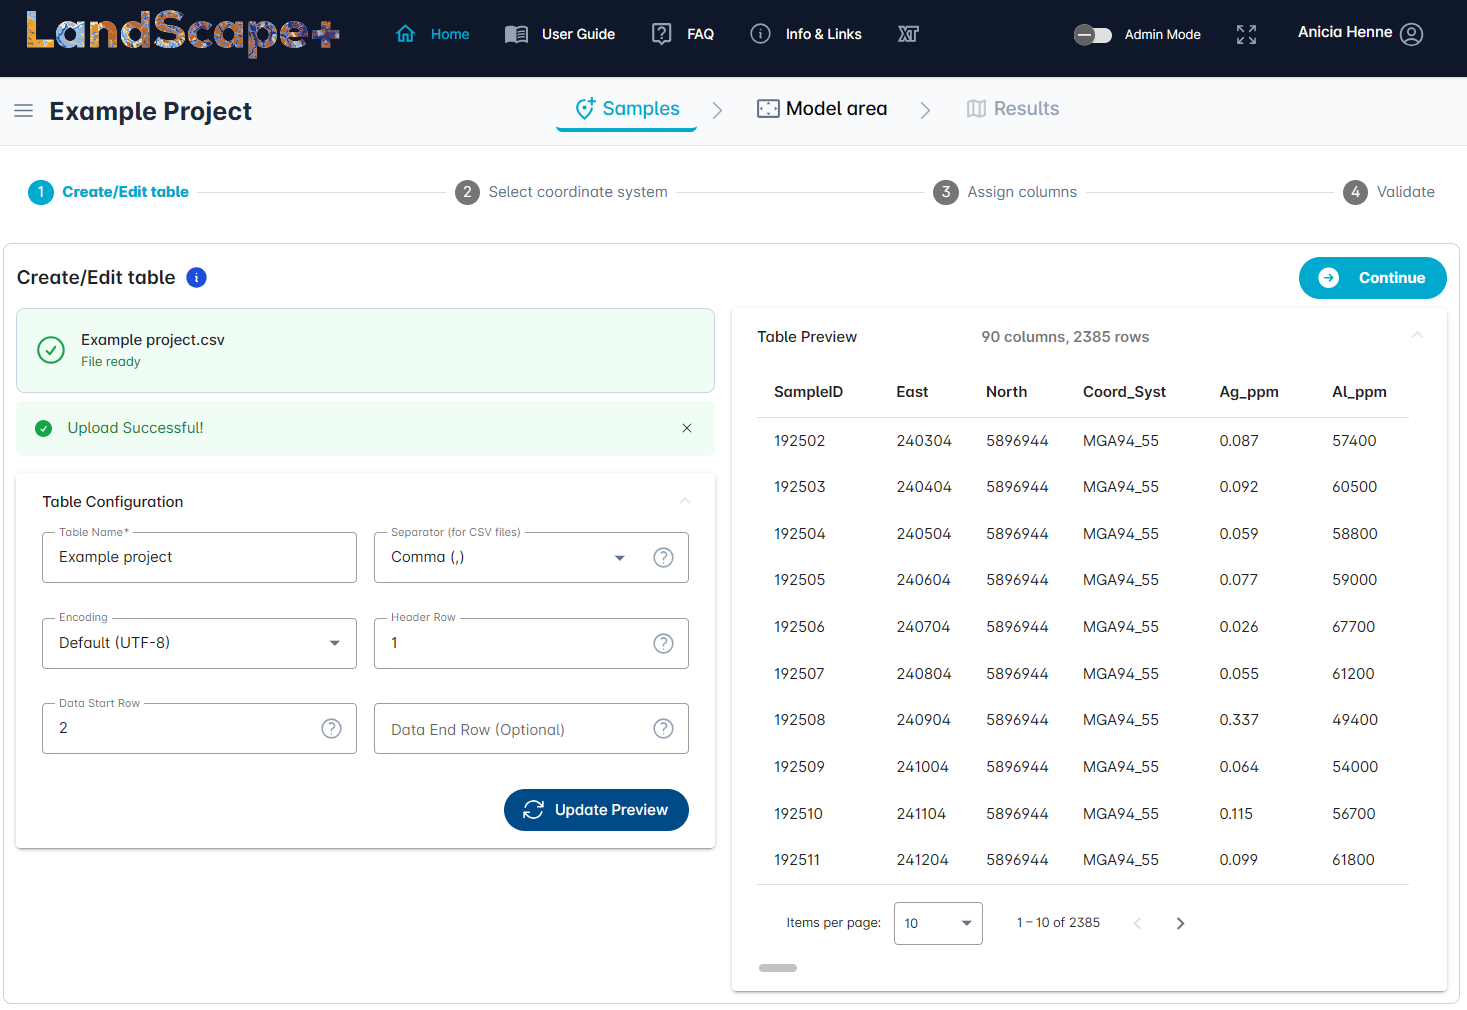
Table name is automatically read-in from the uploaded file name.
Separator default setting is Comma (,) (comma separated). You may choose a different format from the drop-down menu if your data looks incorrect in the Table preview.
Encoding default setting is UTF-8. You may choose a different encoding from the drop-down menu if your data looks incorrect in the Table preview.
Header Row default setting is 1 (the first row of your data sheet contains the headings for your columns). You can change this to any other row. The read-in will ignore any rows above the header row if it is not set to 1.
Data Start Row default setting is 2 (the second row of your data sheet). You may change this if your data does not start in this row (e.g., you may have detection limits and/or units in the row(s) below your header row).
Data End Row default setting is blank. By setting a data end row you can specify not to include all data.
Table settings for Excel files
The Table settings are set to default formats that are most common. The upload also automatically recognises whether your file is a CSV or an Excel file. You can hit the Update Preview button at any point to view how the table settings affect your data read-in.
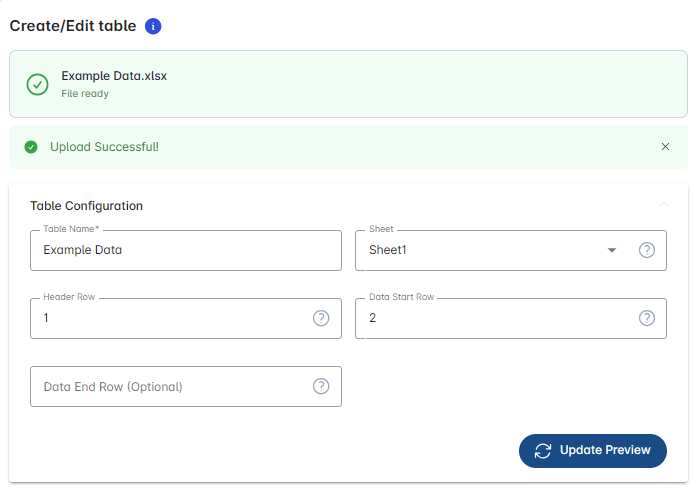
Table name is automatically read-in from the uploaded file name.
Sheet: If your Excel workbook contains multiple sheets, pick the correct sheet with your data from the drop-down menu.
Header Row default setting is 1 (the first row of your data sheet contains the headings for your columns). You can change this to any other row. The read-in will ignore any rows above the header row if it is not set to 1.
Data Start Row default setting is 2 (the second row of your data sheet). You may change this if your data does not start in this row (e.g., you may have detection limits and/or units in the row(s) below your header row).
Data End Row default setting is blank. By setting a data end row you can specify not to include all data.
✔️ Check settings and continue
Once you are satisfied with your table settings, click on the Continue button to go to the next step.
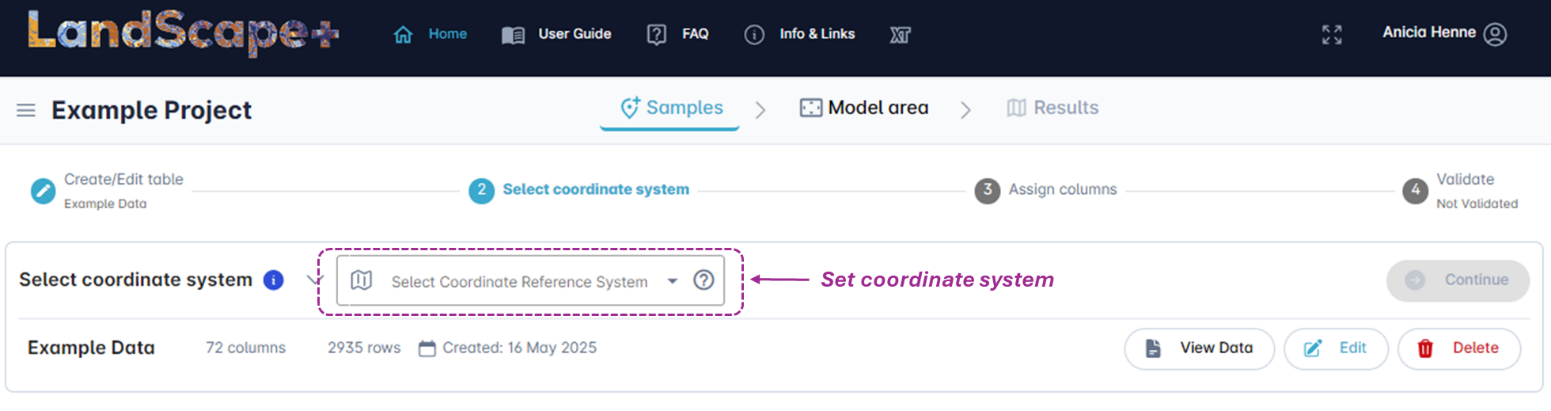
1.3 Select the coordinate system
Select the correct coordinate reference system for your data from the drop-down-menu. You can click on the View Data button to double check the information in your uploaded data.
If you find you have made a mistake, e.g., you realise now that your data does not have coordinates, you can click on the Edit button to return to the previous menu. You can delete your data using the Delete button. Amend the source file and upload the new version.
Once you have selected the coordinate reference system the Continue button will turn from grey  to blue
  . Click on the Continue button to go to the next step.
If you are unsure of your coordinate system and want to double check, click the grey
question mark icon ![]() in the drop-down menu to view an MGA Zone reference map. Note the
longitude references at the bottom of the image.
in the drop-down menu to view an MGA Zone reference map. Note the
longitude references at the bottom of the image.
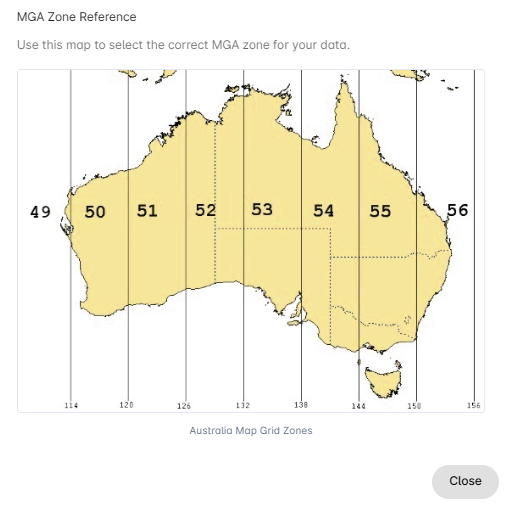
If your samples spread across different MGA zones you must convert them to decimal degrees and repeat the upload.
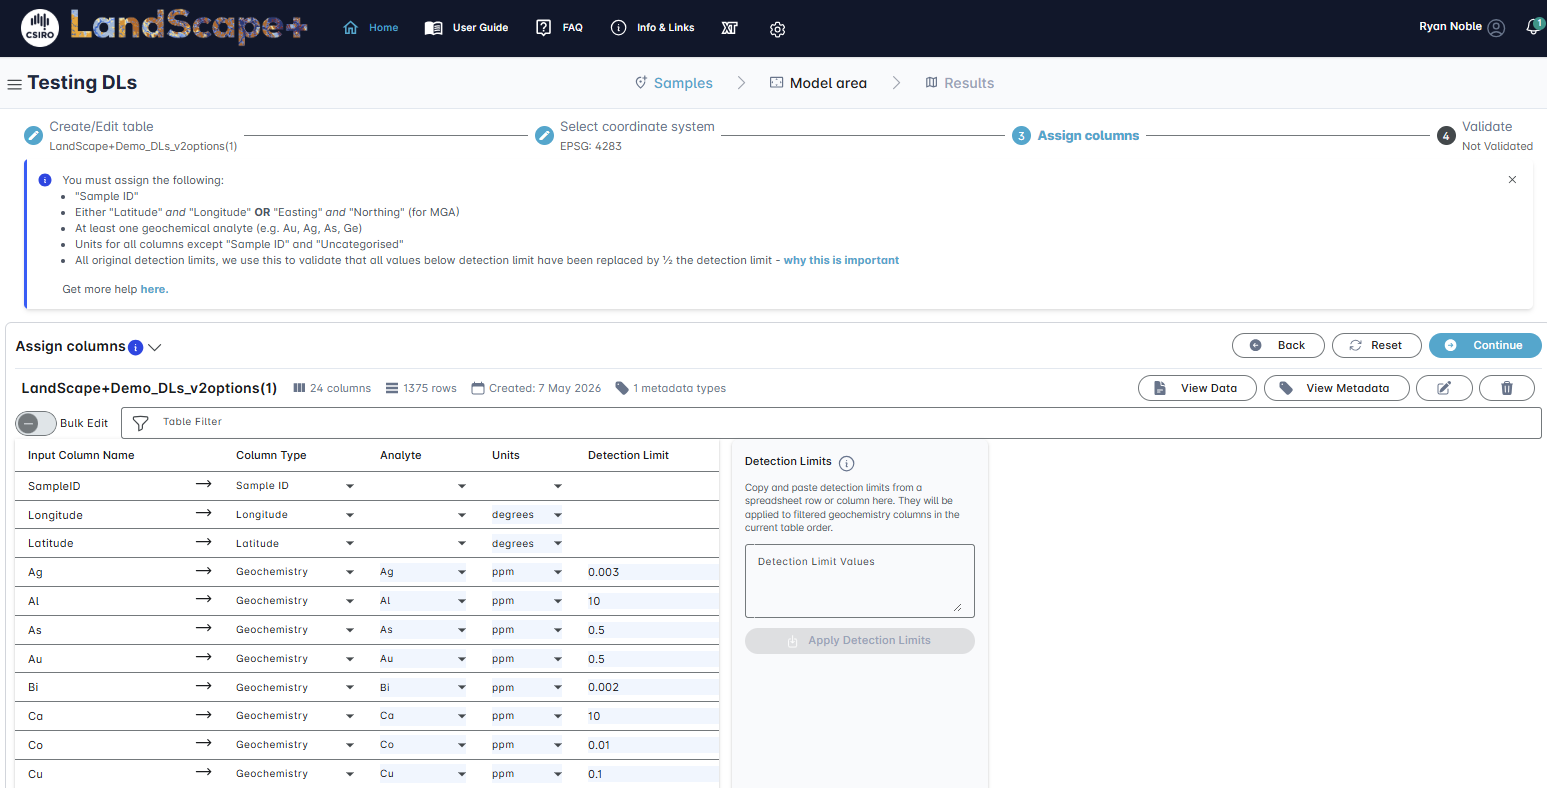
1.4 Assign columns, units and detection limits
The software tool can map some information automatically. However, you must check that all columns have been mapped correctly and assign those the software cannot identify.
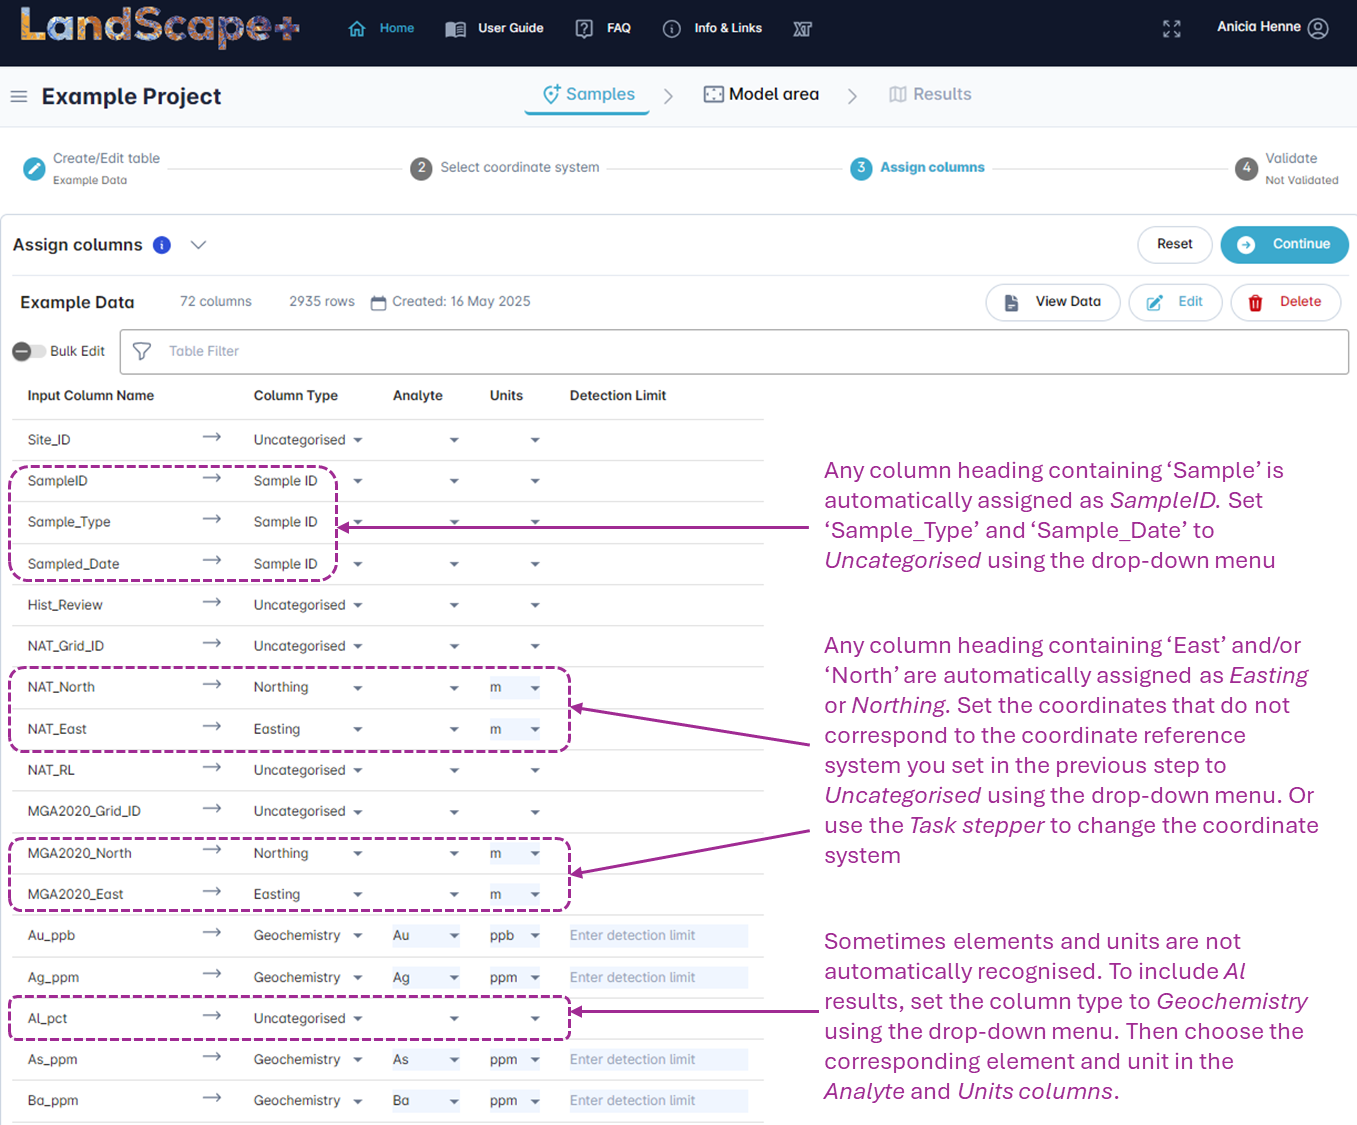
✔️ Assign Column Types
Assign the appropriate column type from the drop-down menu. Options are Sample ID, Geochemistry, Easting, Northing, Latitude, Longitude, Uncategorised, and Soil Properties (for pH and EC).
You must assign the following to continue:
- A "Sample ID" column. All sample identifiers must be unique.
- Either "Latitude" and "Longitude" OR "Easting" and "Northing" (for MGA). If you have both, set one to Uncategorised.
- At least one geochemical analyte (e.g. Au, Ag, As, Ge).
- Any uncategorised columns will not be included in the model outputs.
✔️ Assign an analyte to each Geochemistry column type
All columns mapped as Geochemistry must be assigned an analyte from the drop-down menu. Check all Geochemistry columns are mapped correctly. Change or map any missing analytes using the drop-down menu.
✔️ Assign Units
Select Units for all columns except for "Sample ID", "Uncategorised" and “Soil properties”. All Analytes, Easting and Northing must have a unit assigned to proceed. As long as the correct Units for each analyte are entered, there is no need to convert your values. The application will automatically convert all values in the background to ppm during the validation step.
✔️ Assign Detection Limits
Detection limits can be entered manually or alternatively use the "copy and paste" option immediately to the right. Be sure the order of your detection limits are the same as the Geochemistry data fields uploaded. The "copy and paste" will work from either a row or column in a spreadsheet, or a text-based list with most common seperators. Simply copy and paste the list of detection limit values in the box and click the Apply Detection Limits button. The Apply Detection Limits button will only work if the number of detection limit values matches the number of Geochemistry fields. Re-paste the list if you need to make corrections or manually fix individual fields. The sample upload requires you to enter the lowest originally reported detection limits for each element. This is used during the validation step so the software can flag when values have not been replaced with ½ the detection limit. It is an additional safeguard to help the end-user check their data is suitable for statistical outlier definition. The validation step relies on the user to enter the correct data.
✔️ Check data and continue
Ensure that all required fields (shaded light blue) are filled. If you notice at this point that you do not have all necessary columns or that your table settings were incorrect, you can click on the Edit button to return to the first step. You can also delete the file if it is unsalvageable by clicking the Delete button. The View Data button shows you a current preview of the table. Once you have checked that all information has been mapped correctly, click on the Continue button to proceed to the table validation step.
Tip
 Turn on Bulk Edit to edit multiple attributes at once and use the Filter function to select e.g., the column type Geochemistry only. Be mindful that all changes will apply to all line items that are ticked on the left-hand side (e.g., in this example all Units have been changed to ppm and all detection limits to 0.01. You can hit the Reset button (top right) to return all settings back to the default.
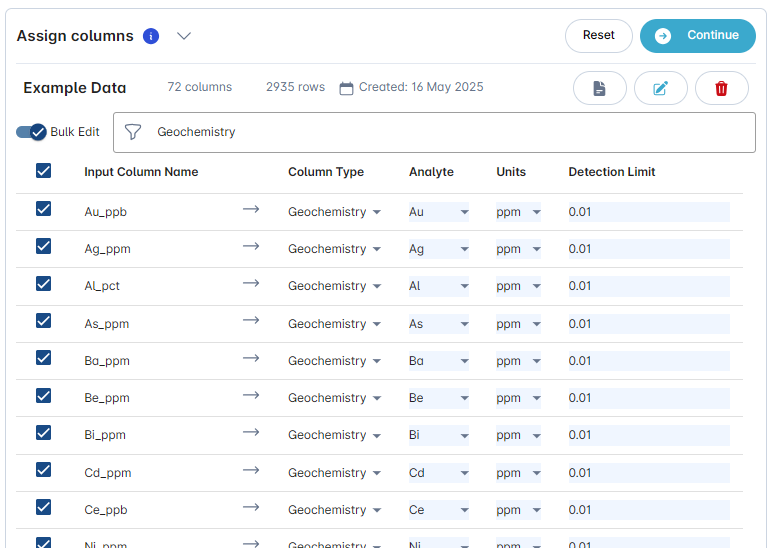
Examples of common data cleaning steps
1.5 Validate data
The table validation is an automated process triggered by clicking the Continue button in the previous step. The validation process is designed to aid the user to identify some erroneous or missing data points. This depends on the user mapping the correct data in the previous steps. Some validation errors can be ignored at the users’ own risk. Others must be corrected to continue.
A Table validation pop-up dialogue will indicate whether the table has passed or failed validation.
✔️ Review action log/correct data
Table is invalid
If the table has not passed validation, the Table validation pop-up dialogue will contain a red cross. A message will detail the error. You cannot proceed until the errors are corrected.
Close the dialogue box to edit the table mapping.
Example – Invalid Table
In the example below, the software has identified 366 samples in the uploaded data that are missing coordinates. In this specific case you will have to return to your original file and add the missing coordinates or remove any samples without coordinates.
Then click on the Edit button to upload the new version of your data. Proceed with Step 1.2.

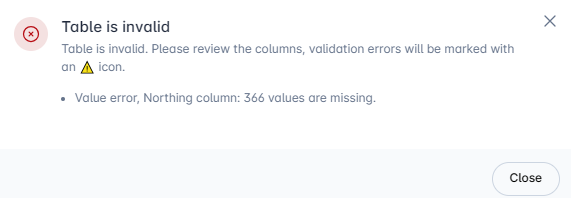
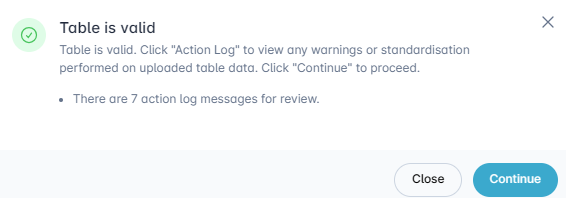
Table is valid
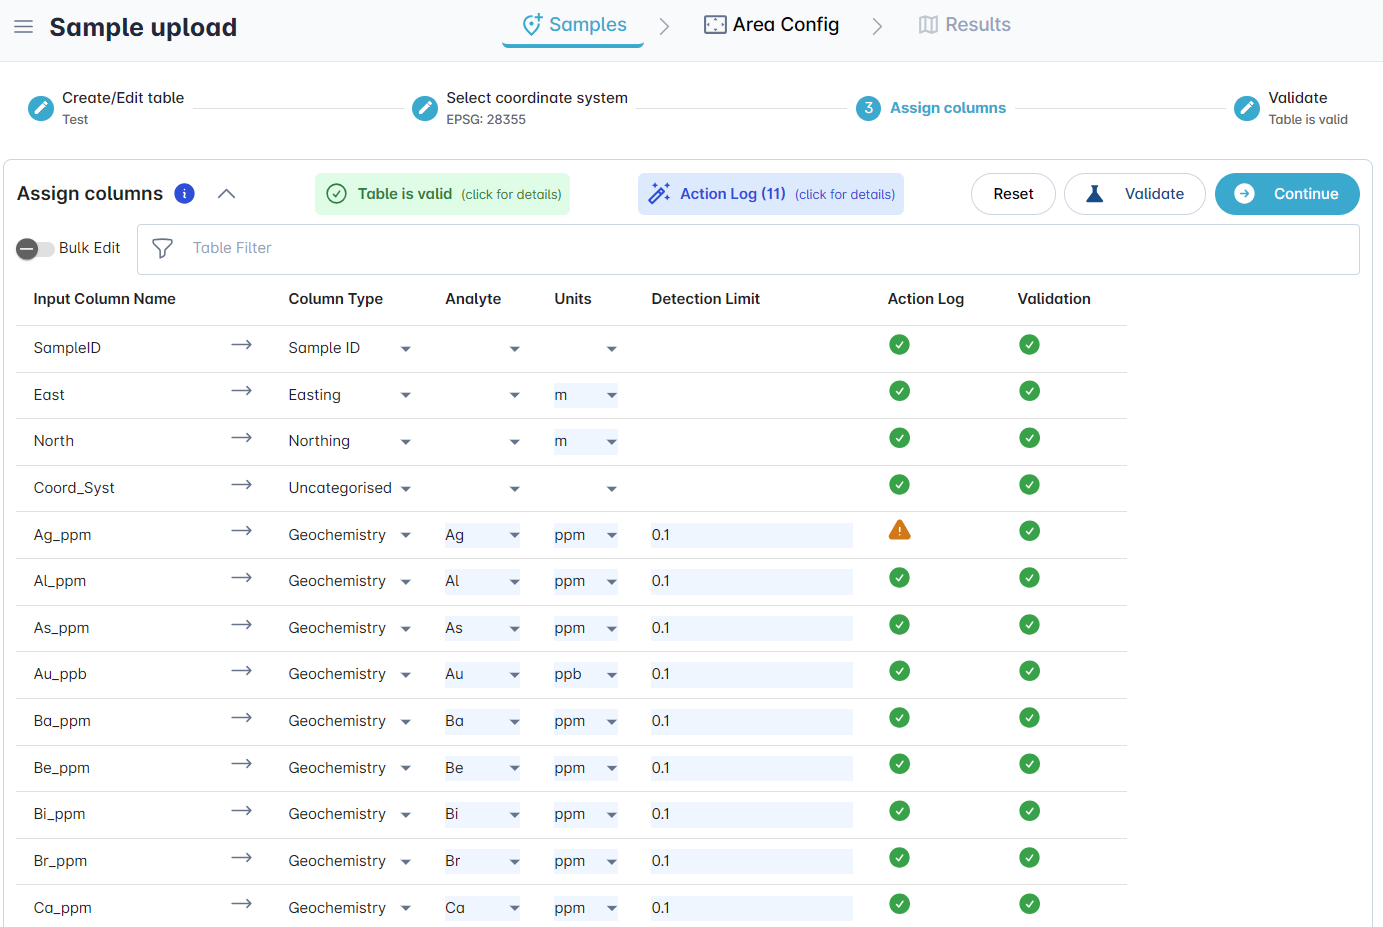
If the table has passed validation, the Table validation pop-up dialogue will contain a green tick. If the message refers to an Action log, close the dialogue box, to click on the Action log. A pop-up dialogue will detail any potential errors for your review. You can also hover over the orange Attention icons for potential errors that affect a specific row.
Example – Valid Table Action Log
In the below example the table has passed validation, and you are able to proceed to the next step. However, the message notes that there are action log messages for your review. If you click Continue, the log will automatically open. Alternatively, you can Close the message and click on the Action log.
In this example, the Action Log describes the identification of flags around detection limits. For 7 elements, values were detected that are below the original detection limit that was entered in the Detection Limit column. However, they are not equal to half the detection limit.
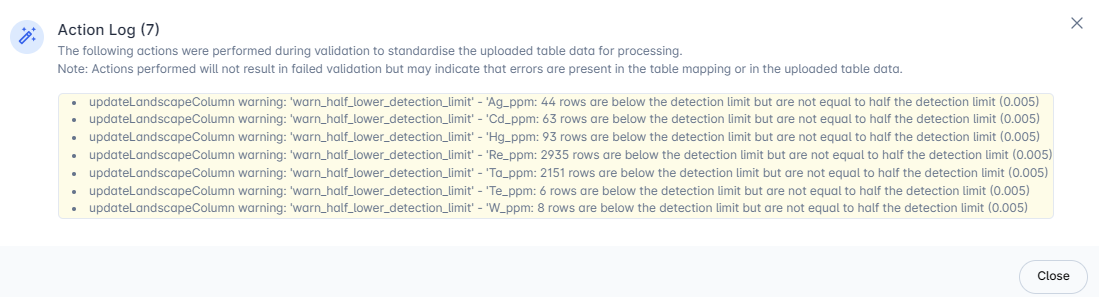
You can also hover over the orange exclamation icons in the Action Log column to view row specific error logs.
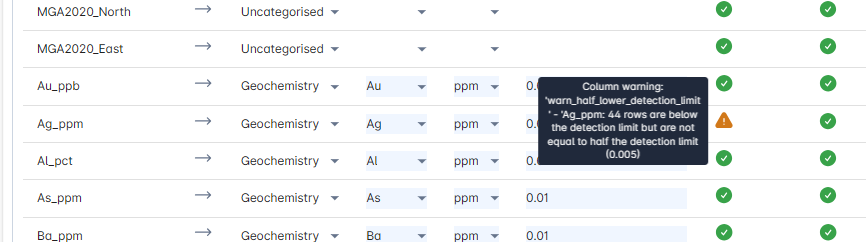
To address this error, check if the original detection limit entered for Ag is correct. If it is incorrect, change it and then click on ![]() (next to the continue button in the main user interface) to repeat the validation. Reiterate this process until no more errors are flagged.
(next to the continue button in the main user interface) to repeat the validation. Reiterate this process until no more errors are flagged.
If the original detection limit is correct, check your data for below detection limit values that have not been replaced by half the detection limits. If you have intentionally chosen to use a different imputation method or have uploaded a data set with multiple detection limits for the same analyte, review that you are satisfied with your choice and click Continue at your own risk.
✔️ Confirm and Continue
Once you are satisfied with your edits, click the Continue button.